Database Performance Tuning
Successful (legacy) applications can develop performance issues over time as the amount of data in the system grows and the usage evolves. Tuning the database can result in quick performance wins without having to perform any refactoring of the application code.
Identifying Performance Hot Spots
All web applications deployed on Tomcat in the IT-DB kubernetes environment export servlet request count and response time metrics to prometheus. Spring boot applications using the prometheus actuator also export similar http metrics that offer more dimensions such as method (e.g. GET, POST) and result (e.g. SUCCESS, SERVER_ERROR).
Tomcat + JMX Exporter
- tomcat_servlet_requestcount_total - number of requests
- tomcat_servlet_processingtime_total - processing time in ms
Spring Boot Prometheus Actuator
- http_server_requests_seconds_count - number of requests
- http_server_requests_seconds_sum - request processing time in s
To calculate the average response time over a period of time, divide the rate of request processing time by the rate of number of requests. Using the topk function we can limit the results to the slowest requests.
Note: The rate prometheus function calculates the average change in the metric per second over a time period (e.g. 20minutes). The increase function gives similar results but in terms of the actual change over the time range, and can be more useful for displaying in a dashboard, especially if the number of events per second is low. Somewhat unintuitively, if you divide the rate of processing time by the rate of the number of events you get the average processing time per event over the time period.
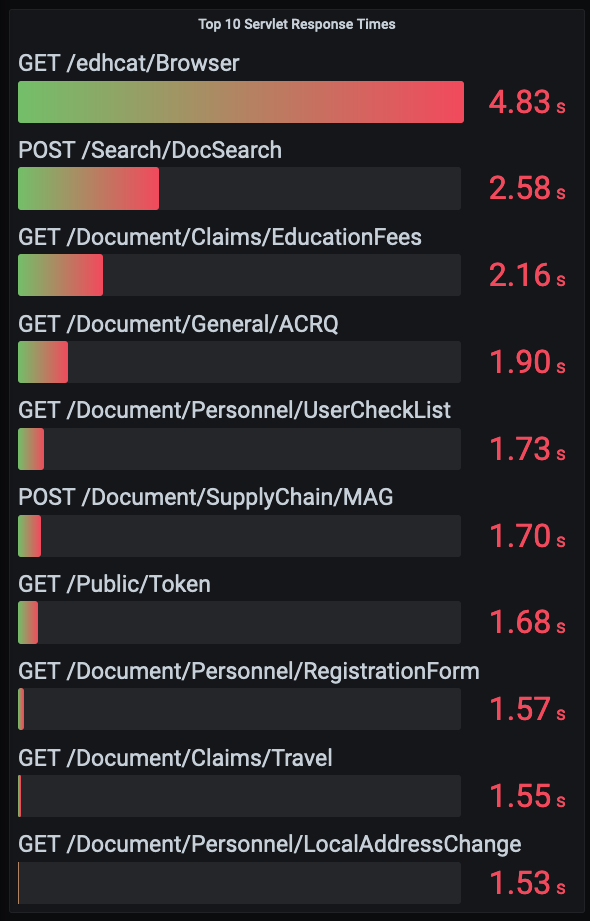
This can be displayed as a bar gauge in a grafana dashboard:

Try the query in prometheus:
topk(10,
  sum by (module, uri, method) (rate(http_server_requests_seconds_sum{application="edh", environment="PROD"}[20m]))
    / sum by (module, uri, method) (rate(http_server_requests_seconds_count{application="edh", environment="PROD"}[20m]))
)
Low Hanging Fruit
Once a slow response has been identified review the code to determine if tuning will result in benefits. The ideal candidate for improvements is a request that results in a single database query and returns the results. Requests that require multiple queries or integrations with external systems are not so easy to improve with minor database tuning and will likely require refactoring to improve performance. Also consider how often this type of request is made. If it’s only once per day perhaps a 2s response time is OK, if it’s once per hour, maybe 2s is too slow.
What is acceptable performance? An unscientific rule of thumb:
- < 0.1s for loading single resource by identifier
- < 0.5s for a search with a date range and search parameters
- < 2s for 99% of all requests
A search form will often have multiple input fields. You will need to understand how users use the search in order to apply appropriate performance tuning. Is a date range used? What search parameters are common? Are there common combinations or parameters? To answer these questions you will need additional logging in your application. Either from the frontend with something like Matomo or from server side logging.
In EDH, a lot of the document searches use the ART framework and each request is logged to the artlog table along with a semi-human readable (thus difficult to machine read) description of the query parameters.
From this, I found that most searches for the “Termination Checksheet” use the default 3 month time period. Occasionally a longer time period is used and the performance quickly degrades. If no time period is used in the search the response takes so long to return the user gives up (over 1 hour!).
Indexes
A typical query of the checksheetoverview might be by department for the last 3 months. Which results in this query:
SELECT *
FROM checksheetoverview
WHERE
  department = 'FAP' and cr_date >= date'2021-02-01'
;

-- checksheetoverview is a view over the checksheet table hiding the complexity of processing the XML content
-- sometimes it can be easier to attack the query directly instead of the indirection from the view
SELECT doc_id, status, cr_date, fname||' '||sname as fullName, cid, department, per_status, pgm, contract_end_date, lwd, person_future_status, items_list
FROM checksheet,
XMLTABLE ('$d/document/person-concerned' passing checksheet.xml as "d"
    COLUMNS
        fname VARCHAR2(50)     PATH 'firstname/text()',
        sname VARCHAR2(50)     PATH 'surname/text()',
        cid   VARCHAR2(10)    PATH 'cid/text()',
        department   VARCHAR2(10)    PATH 'department/text()',
        per_status   VARCHAR2(10)    PATH 'person-status/text()',
        pgm   VARCHAR2(10)    PATH 'pgm/text()',
        contract_end_date DATE          PATH 'contract-end-date',
        lwd               DATE          PATH 'lwd',
        person_future_status   VARCHAR2(10)    PATH 'person-future-status/text()',
        items_list   VARCHAR2(256)    PATH 'items-list/text()'
        ) AS X
WHERE
  department = 'FAP' and cr_date >= date'2021-02-01'
;
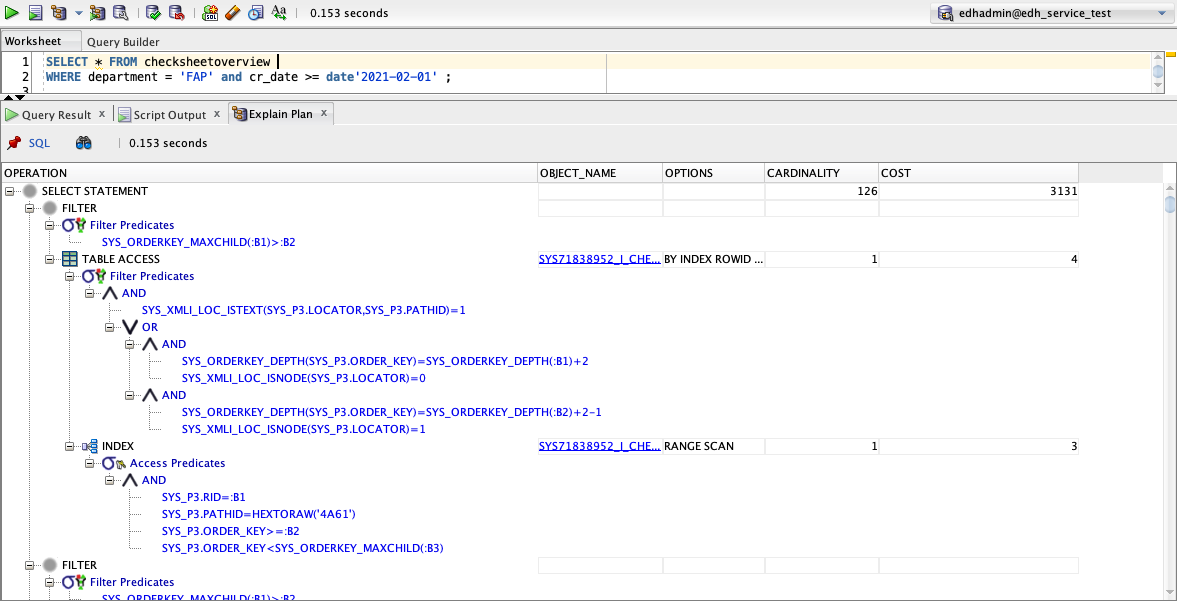
Using SQL developer to review the plan we can see what if any indexes are used to support the query:

The plan shows FULL access of the checksheet table with no indexes. Perfect, we can easily add an index on cr_date since most of the queries use a date range
CREATE INDEX i_checksheet_crdate ON checksheet(cr_date);
After adding an index on cr_date, we can see the plan has improved, but the estimated cost of the query is only fractionally better and real world performance hasn’t changed. This is because for this query, most of the complexity is in the XML processing. When a date range is provided, even without an index the database has no problem scanning the 12’000 rows to find the matches within the given time range. It then has to process the XML content for each of the matches to check the department. Without improving the XML processing an index on cr_date is not going to result in any noticeable performance improvements.

Oracle supports XML indexes so I checked with IT if there are any issues with using one: in general no, just be aware of size. With only 12k rows, size isn’t a problem here. For an XML index we need to specify the path to the element to index. Since the checksheet overview view only uses child elements from the person-concerned element, I used that as the base path for the index meaning that searching on any of the fields exposed by the view would benefit from the index
CREATE INDEX i_checksheet_xml_person ON checksheet (xml)
  INDEXTYPE IS XDB.XMLINDEX  PARAMETERS ('paths (include (/document/person-concerned))');
Now the query plan gets weird. I don’t know what Oracle is doing with the XML index but the estimated cost has improved a bit more and real world performance has improved a lot. What’s interesting is that Oracle is using both the XML index and the cr_date index, usually only one index is used per table access but here we benefit from both!

Results
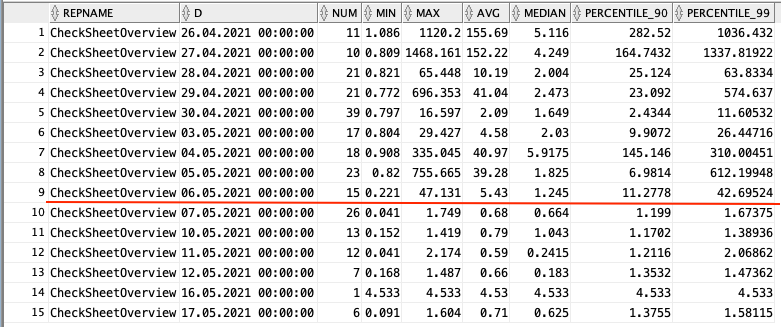
After deploying our new indexes via liquibase, we can check the real world results from actual user searches. A few days later, the average response time for termination checksheet searches has dropped to below 1s, not quite below 0.5s as I would have hoped. However, worst case performance at the 90th and 99th percentile have drastically improved! Almost 99% of all searches are finishing within 2s!

But …
But what if your table already contains indexes and query performance is still not satisfactory? Maybe partitioning could be helpful… see Improving performance with partitions