When you don't test in prod...
During some maintenance of a materialised view in Greybook we investigated whether it was really necessary or could be replaced with a view.
After some testing we discovered a nasty query that resulted in the Efficient Data Access with PIVOT blog post and decided that for now we would leave the materialised view as is and only make the small change necessary for the task at hand, but we would replace one unused index with another index similar to one in the source table as it seemed like an obvious index that would improve performance.
The materialised view was recreated with the small change we had to make and the new index created. The changes were deployed with liquibase and we marked the Jira as done after checking that the application was up and working as intended…
Testing in production
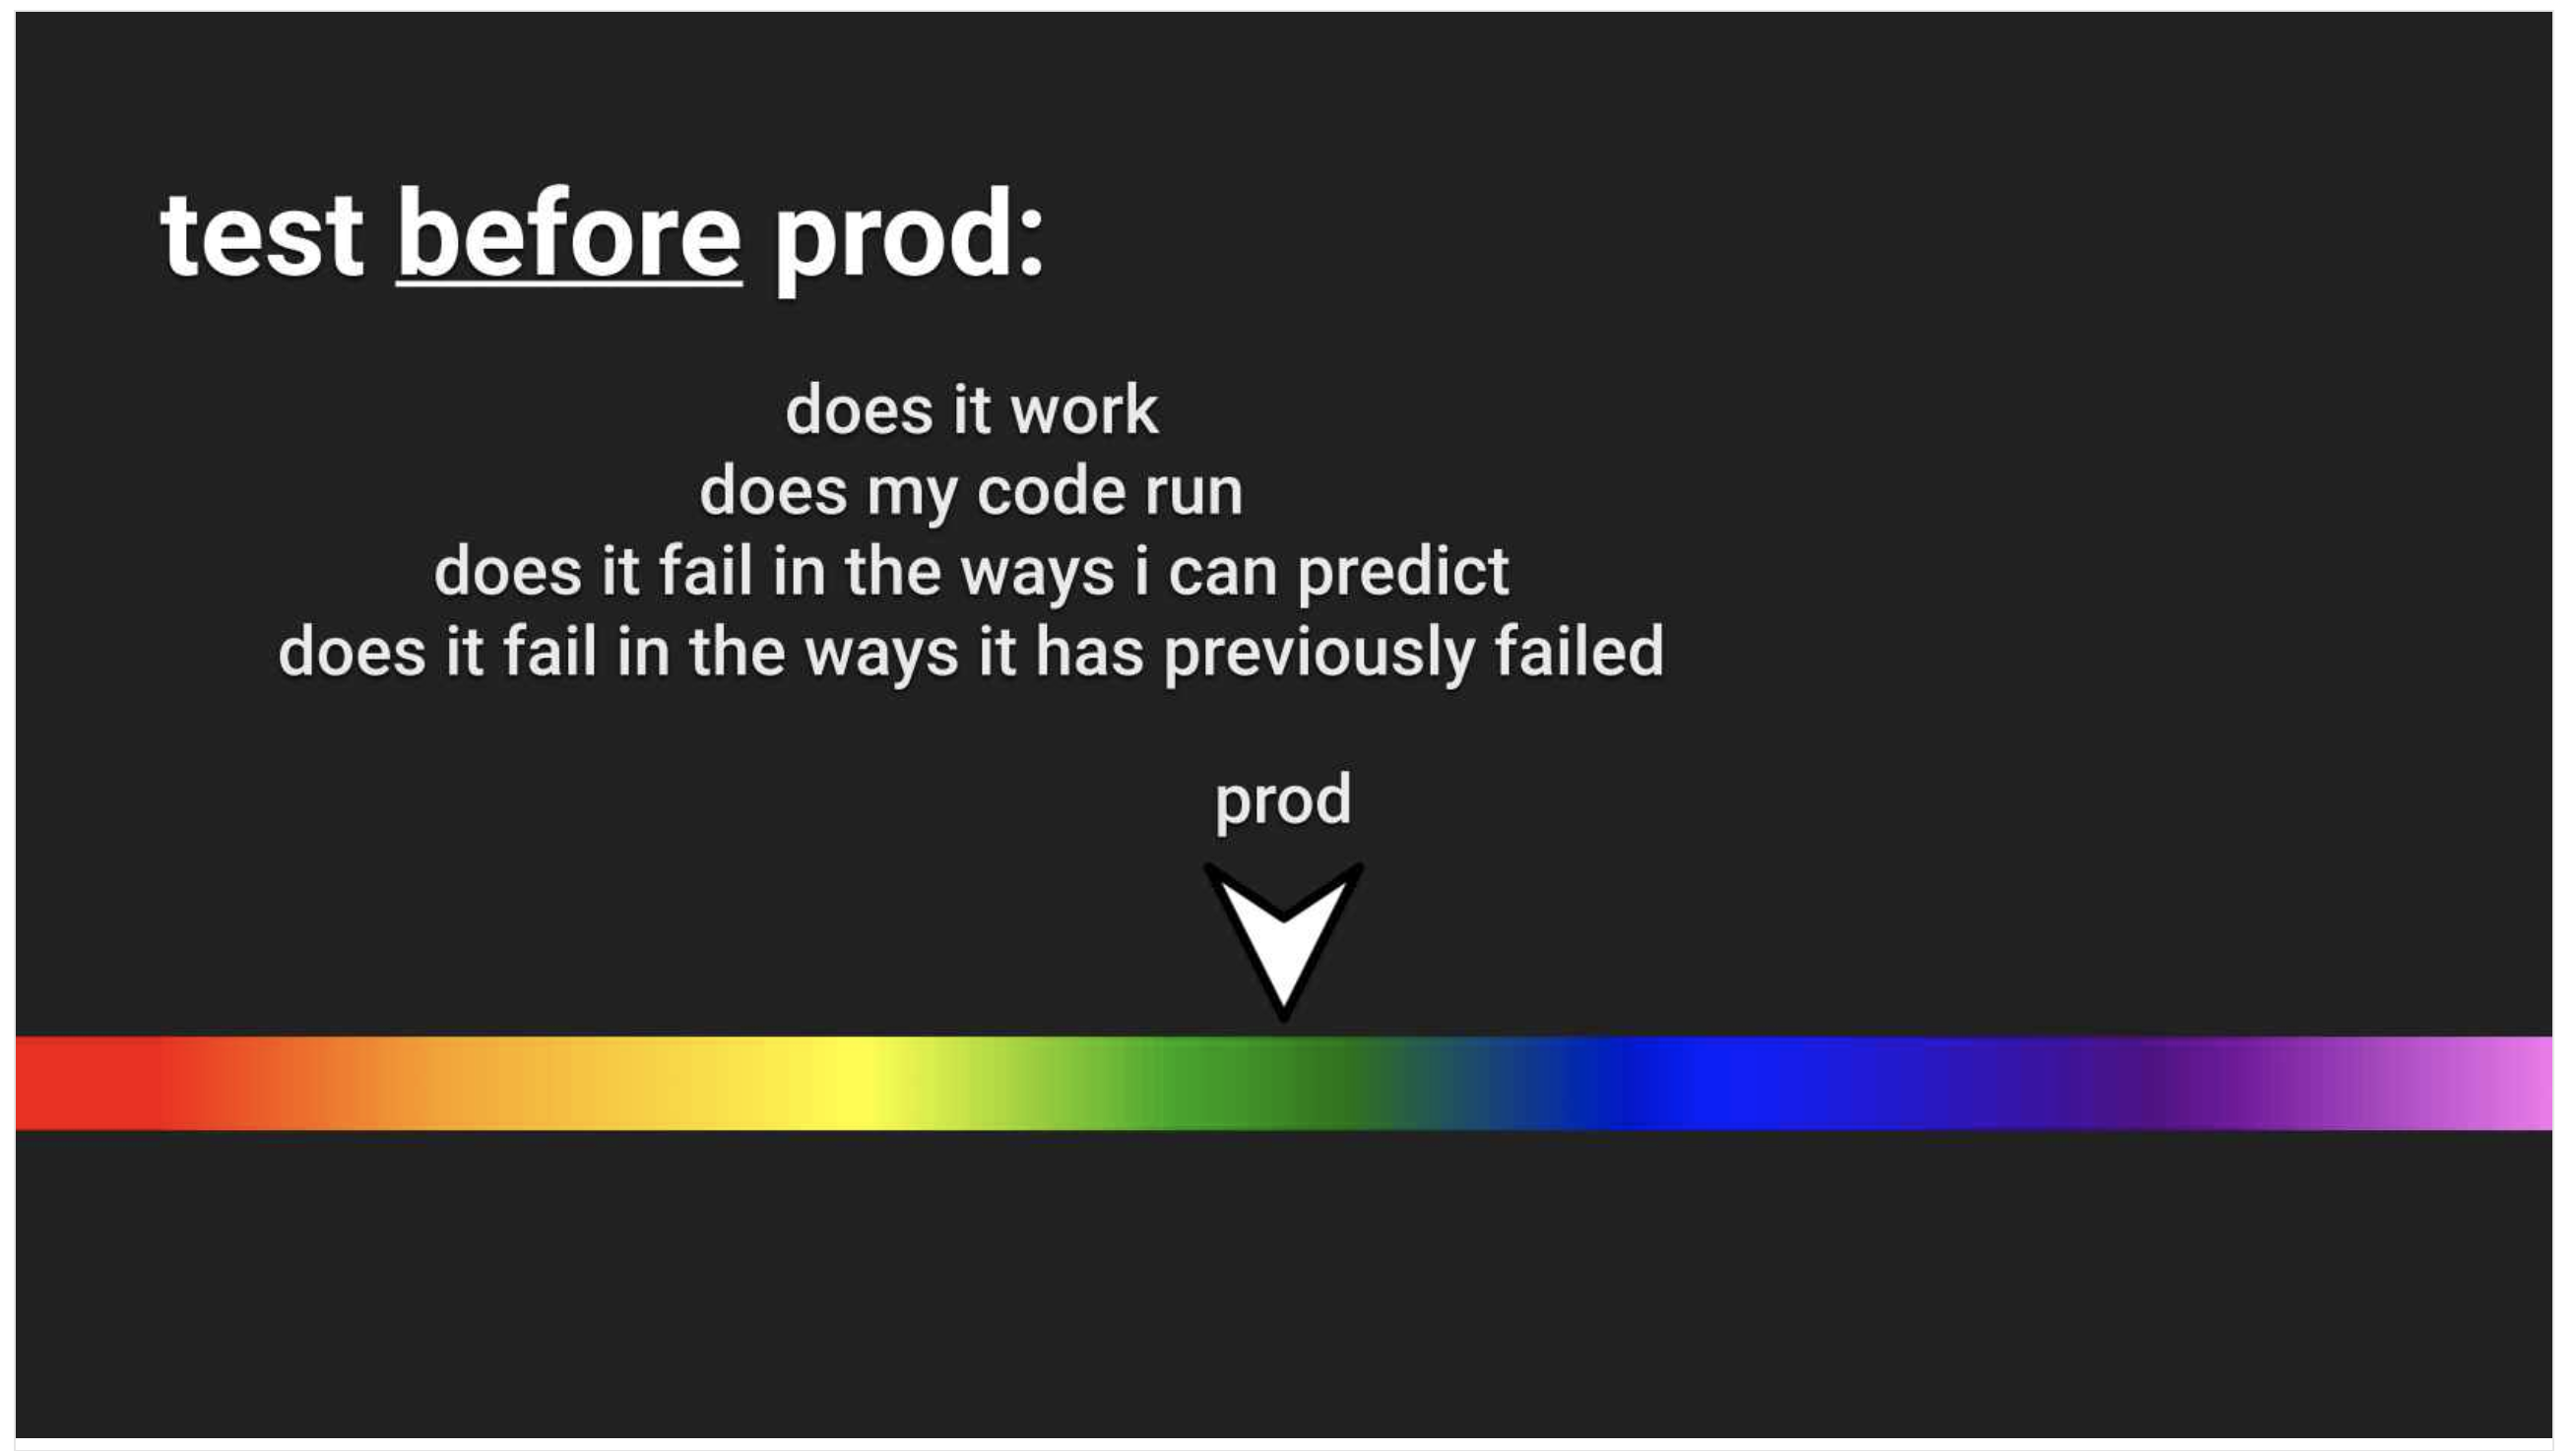
We generally put a lot of emphasis in testing during development, we make sure our change does what it should do and try to catch any unexpected side effects. After a few iterations we’re happy with the change and we ship it. Often, that’s where our interest in the change ends. Unless we receive an incident from a user we forget about the task and move on to the next story.
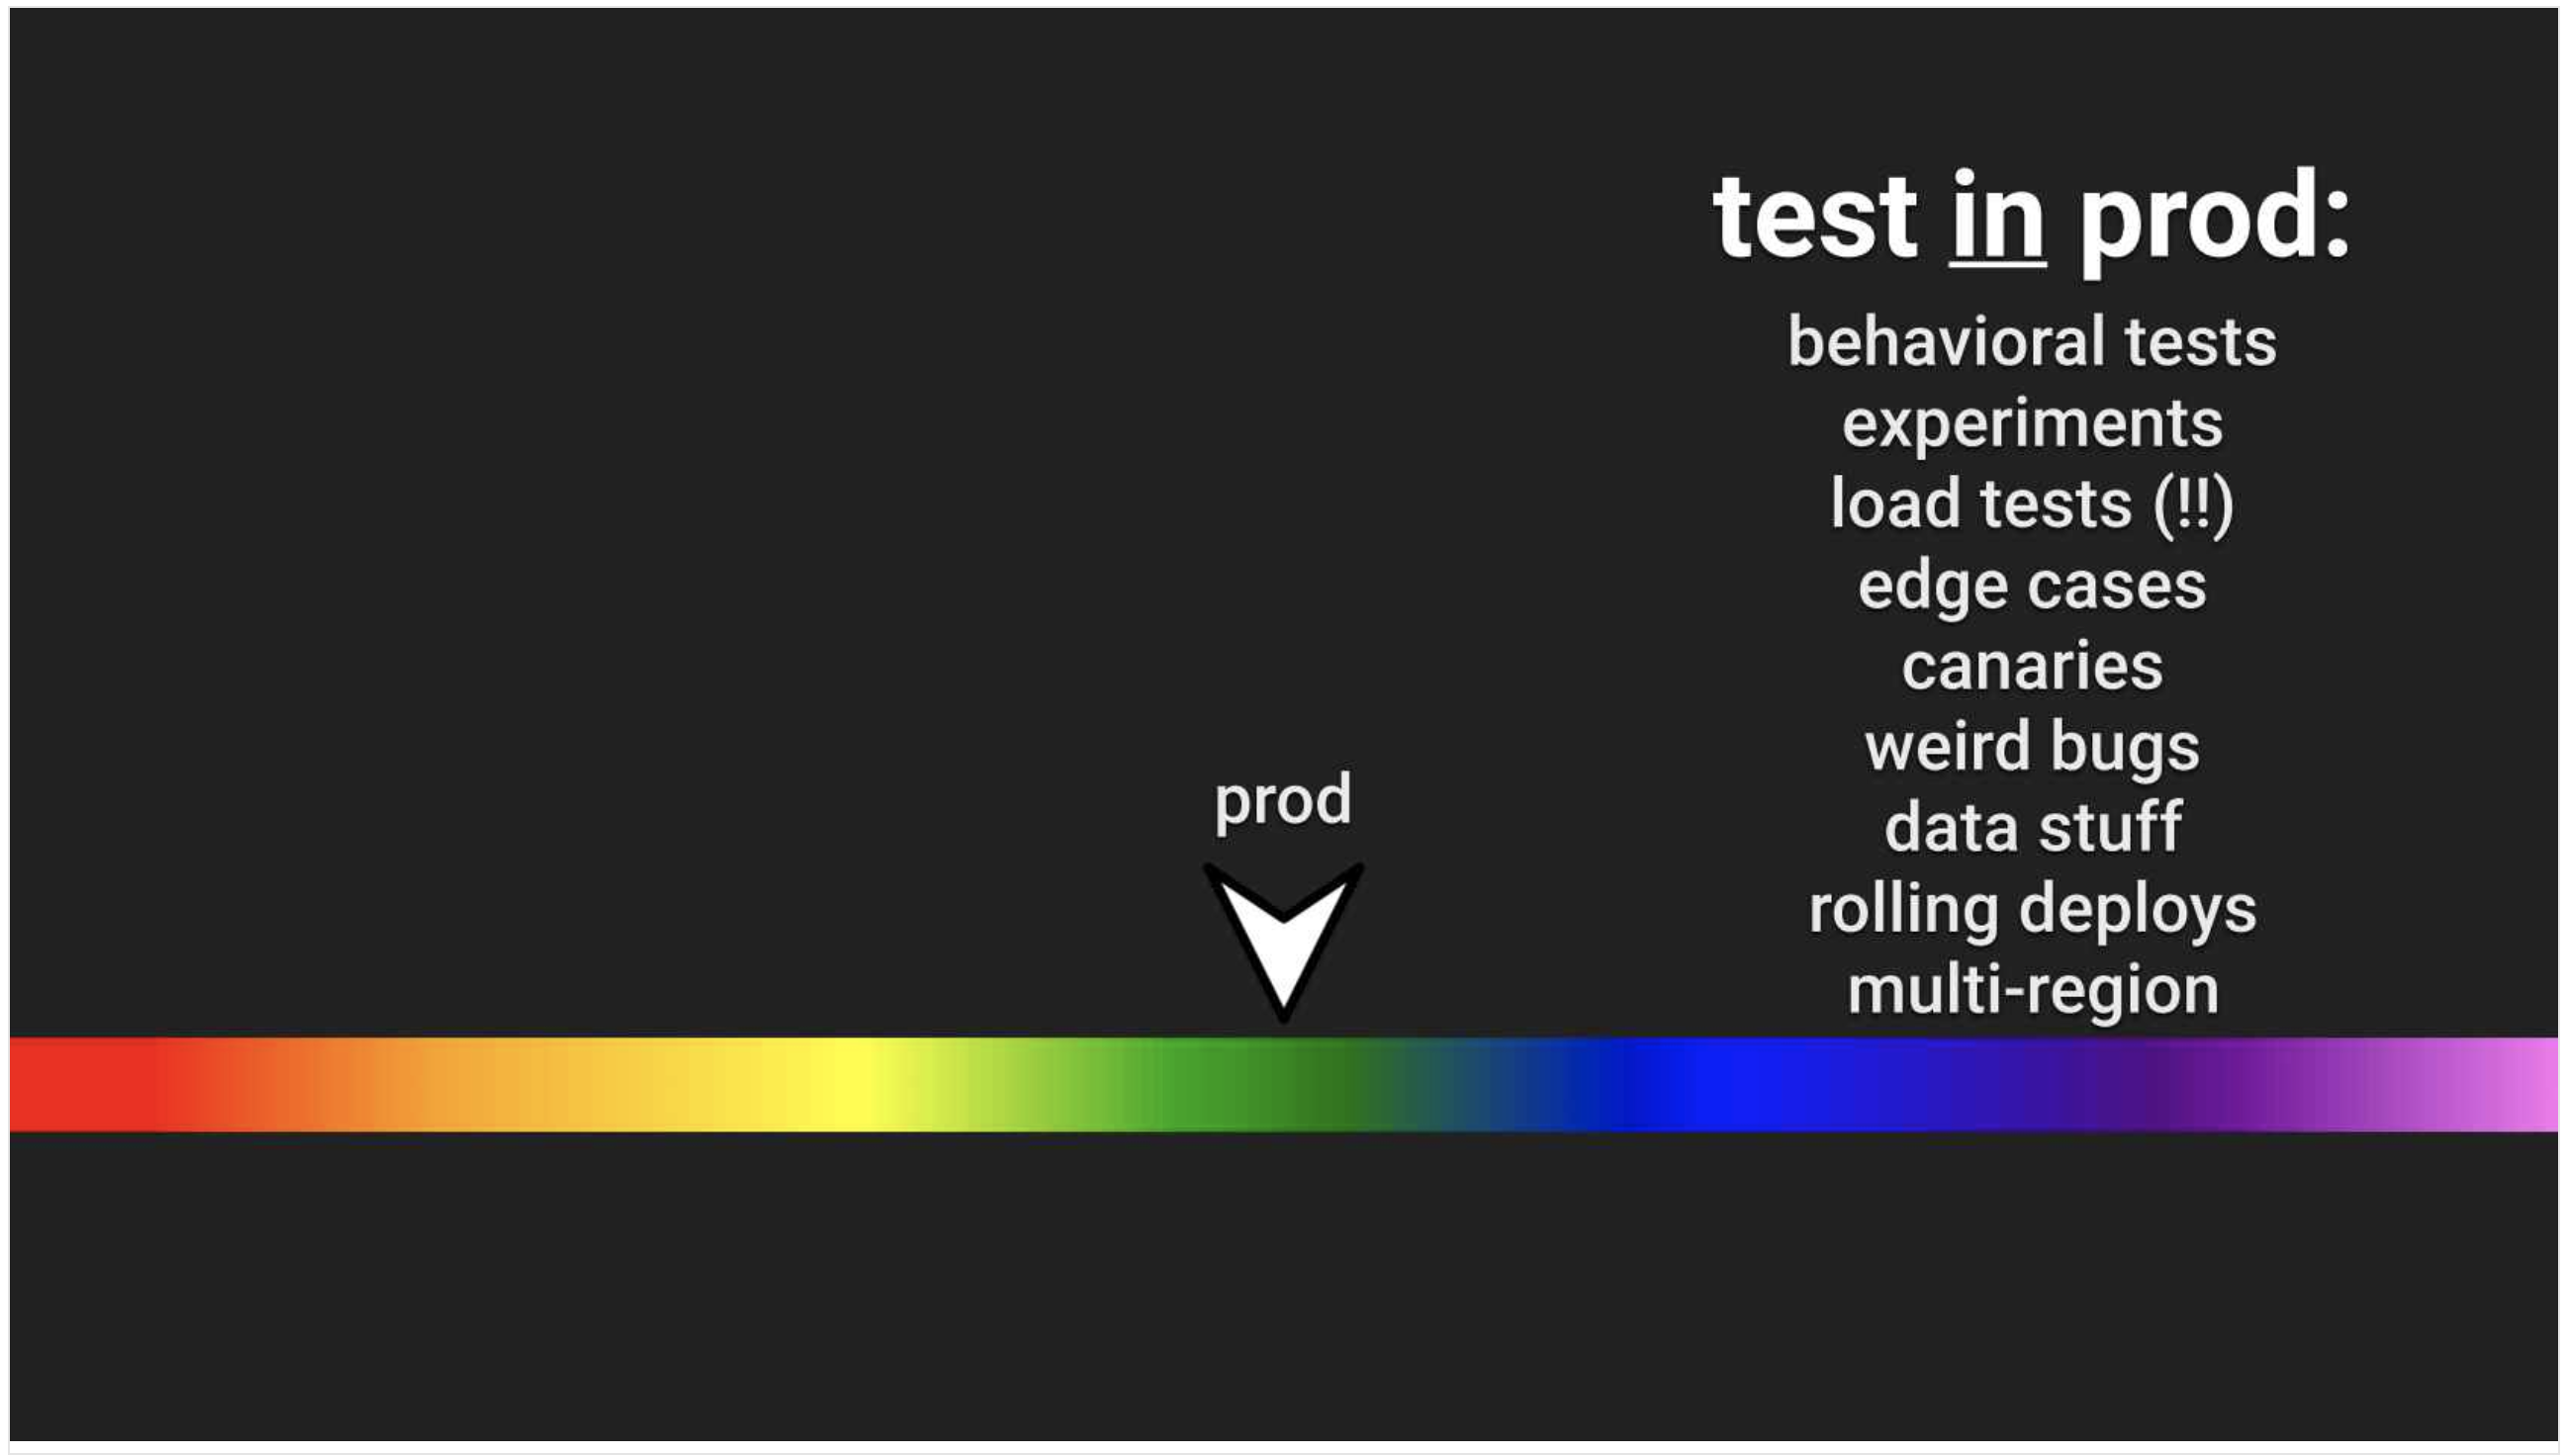
Wouldn’t it be better if we caught the errors that slip through before our users notice there is a problem? To do that we need to test in prod! Or rather, we need to observe how our applications and users respond to changes in the system, look out for anomalies and proactively respond before the user has a chance to complain.
Grafana, Prometheus and Kibana are all tools at our disposal to monitor and observe our applications in production.
DBMS Jobs
Database scheduled jobs can be monitored by enabling scheduler events as described in Monitoring DBMS Scheduled Jobs. Each time the job runs metrics are pushed via the prometheus push gateway that include the result, duration and cpu usage of the job.
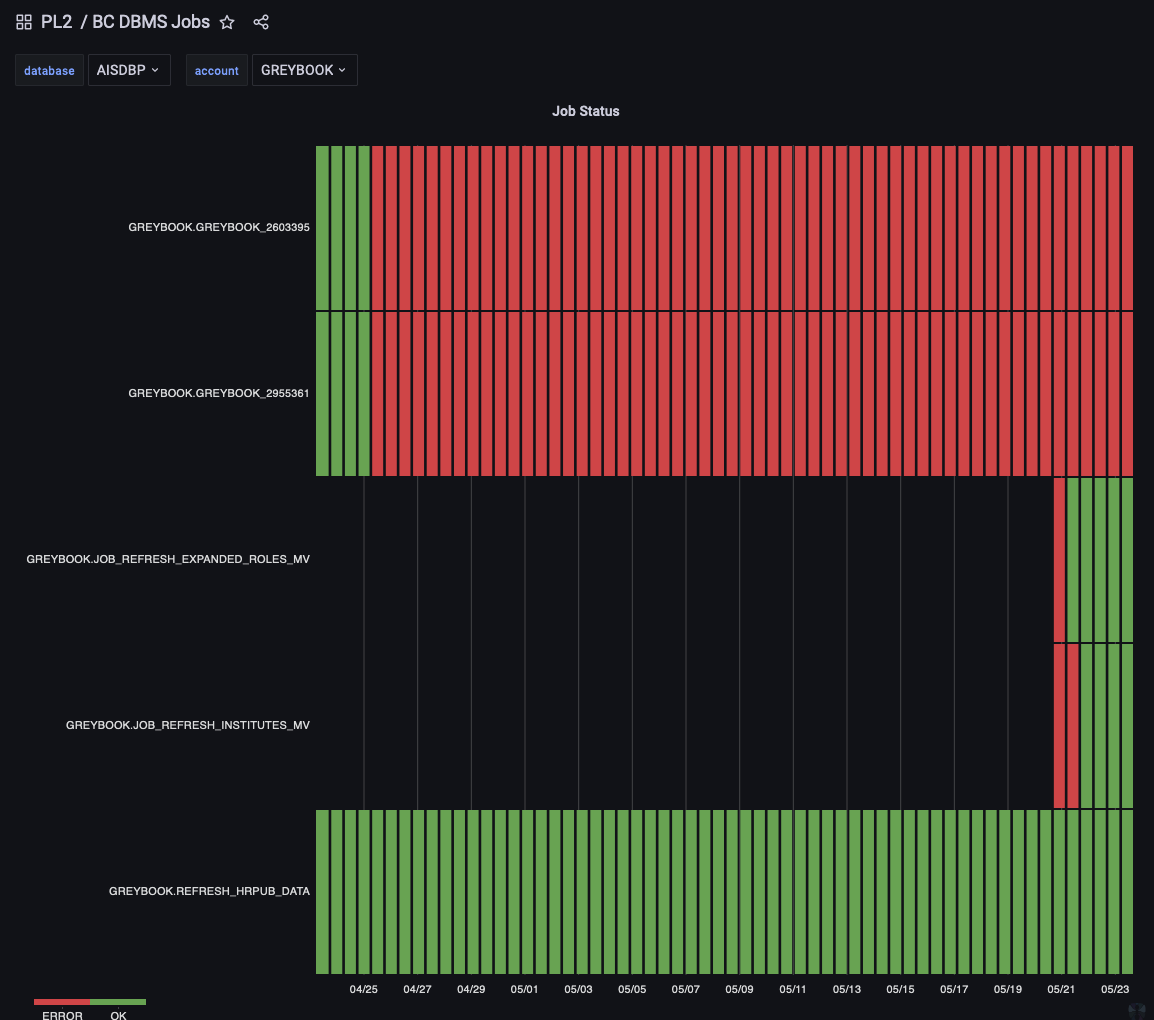
Had we checked the BC DMBS Jobs Dashboard or set up an alert in the Prometheus Alertmanager we would have noticed that the DBMS jobs that refresh the materialised view stopped working after the deployment of our change.
Since the data doesn’t change very often, the application appeared to operate as normal, if we had detected the issue we could have fixed the DBMS jobs and restarted the data refresh without our users ever noticing. Unfortunately we didn’t and it took a few weeks for a user to complain and raise a support incident that then required time for the supporter to investigate and the issue and fix it.

HTTP Performance
That index we created that seemed like a good idea? It turns out it wasn’t… due to the data skew for certain experiments, the database optimiser made some widely inaccurate estimations about the number of results that would be returned by certain access patterns and came up with a plan that used the new index in a very inefficient way.
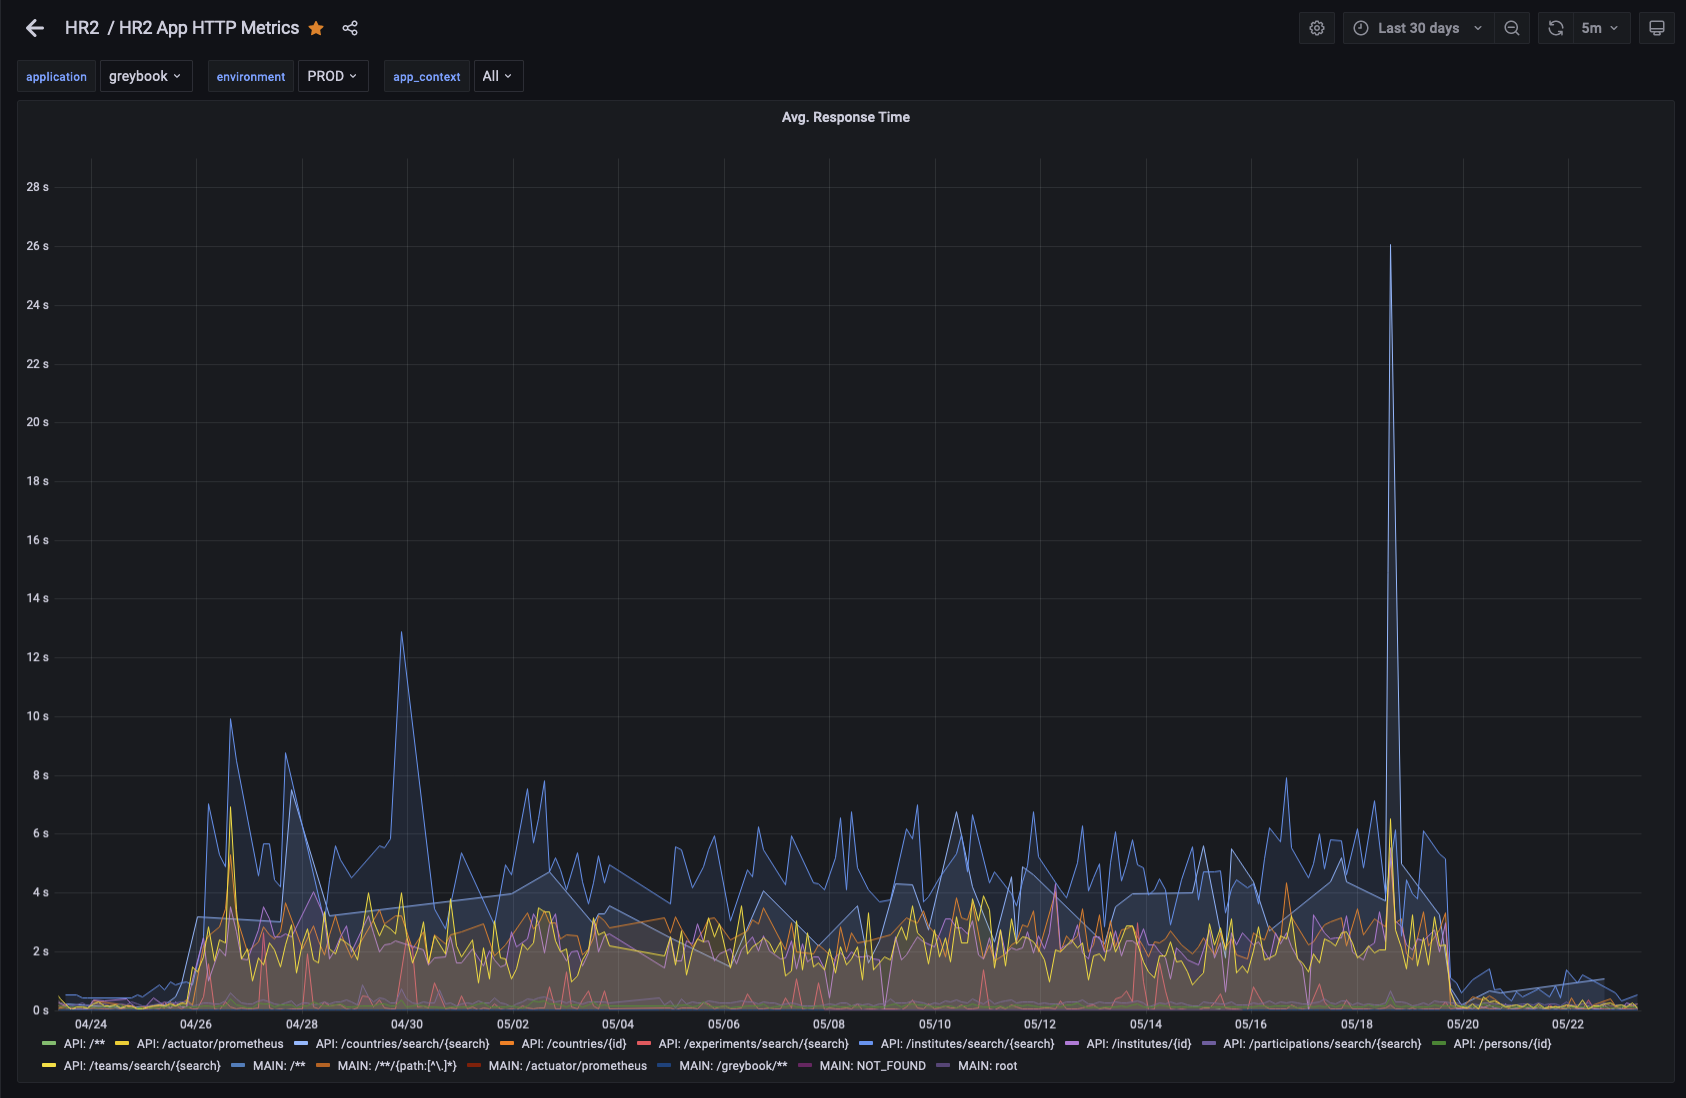
This resulted in an immediate performance regression from several api end points. Instead of taking less than a second to respond, some requests started taking 2-5s to respond. This is slow enough for the user to notice that the page is slow, but not so slow that they might complain.
Our API is a spring boot application that uses the spring boot actuator to expose metrics such as http response times to prometheus. The average response time is charted in a Grafana dashboard as well as other metrics such as requests per second and the error rate of requests.
Here’s what the average response time looks like for the last month. Can you see when the errant index was created, and then when it was dropped?

Special thanks to our colleagues in IT-DB who helped dive in to the query plans for the slow queries and confirm that the new index resulted in sub-optimal query plans and recommended it’s removal!
Conclusion
Despite our best efforts to catch errors before they reach production, they will always slip through. To minimise the impact we need to be constantly monitoring and observing our applications, especially after a change is introduced, so that we can catch and fix errors while the change is fresh in our minds instead of waiting for a user to report the issue and pay the cost of context switching between tasks.
Now go watch this talk from the co-founder of Honeycomb, Charity Majors @mipsytipsy

